
# Netdata
# Overview
Netdata is distributed, real-time performance and health monitoring for systems and applications. It is a highly-optimized monitoring agent you install on all your systems and containers. It provides unparalleled insights, in real-time, of everything happening on the systems it's running on, using highly interactive web dashboards. A highly-efficient database stores long-term historical metrics for days, weeks, or months, all at 1-second granularity. It is fast and efficient, designed to permanently run on all systems (physical and virtual servers, containers, IoT devices), without disrupting their core function.
Netdata is disabled by default. To turn it on, find the Netdata tile on your MyNode home page and click Enable. Once it is running, click Open on the same tile, as shown here. The Open Netdata button in the Status section of the Settings page opens it too.
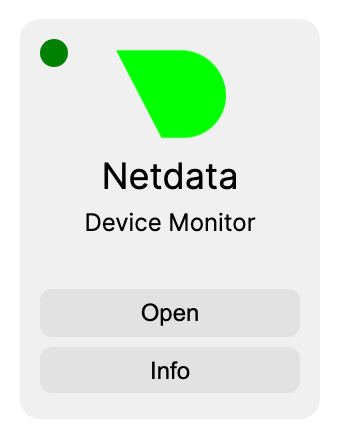
Your Netdata dashboard will open in a new window, and will take a few seconds to fully populate with data. The images below show some of the comprehensive operating data that will be available to you.


# Specs
- Github: netdata/netdata (opens new window)
- Live demo: london.my-netdata.io/ (opens new window)
- Ports: 19999/20000